

Apps
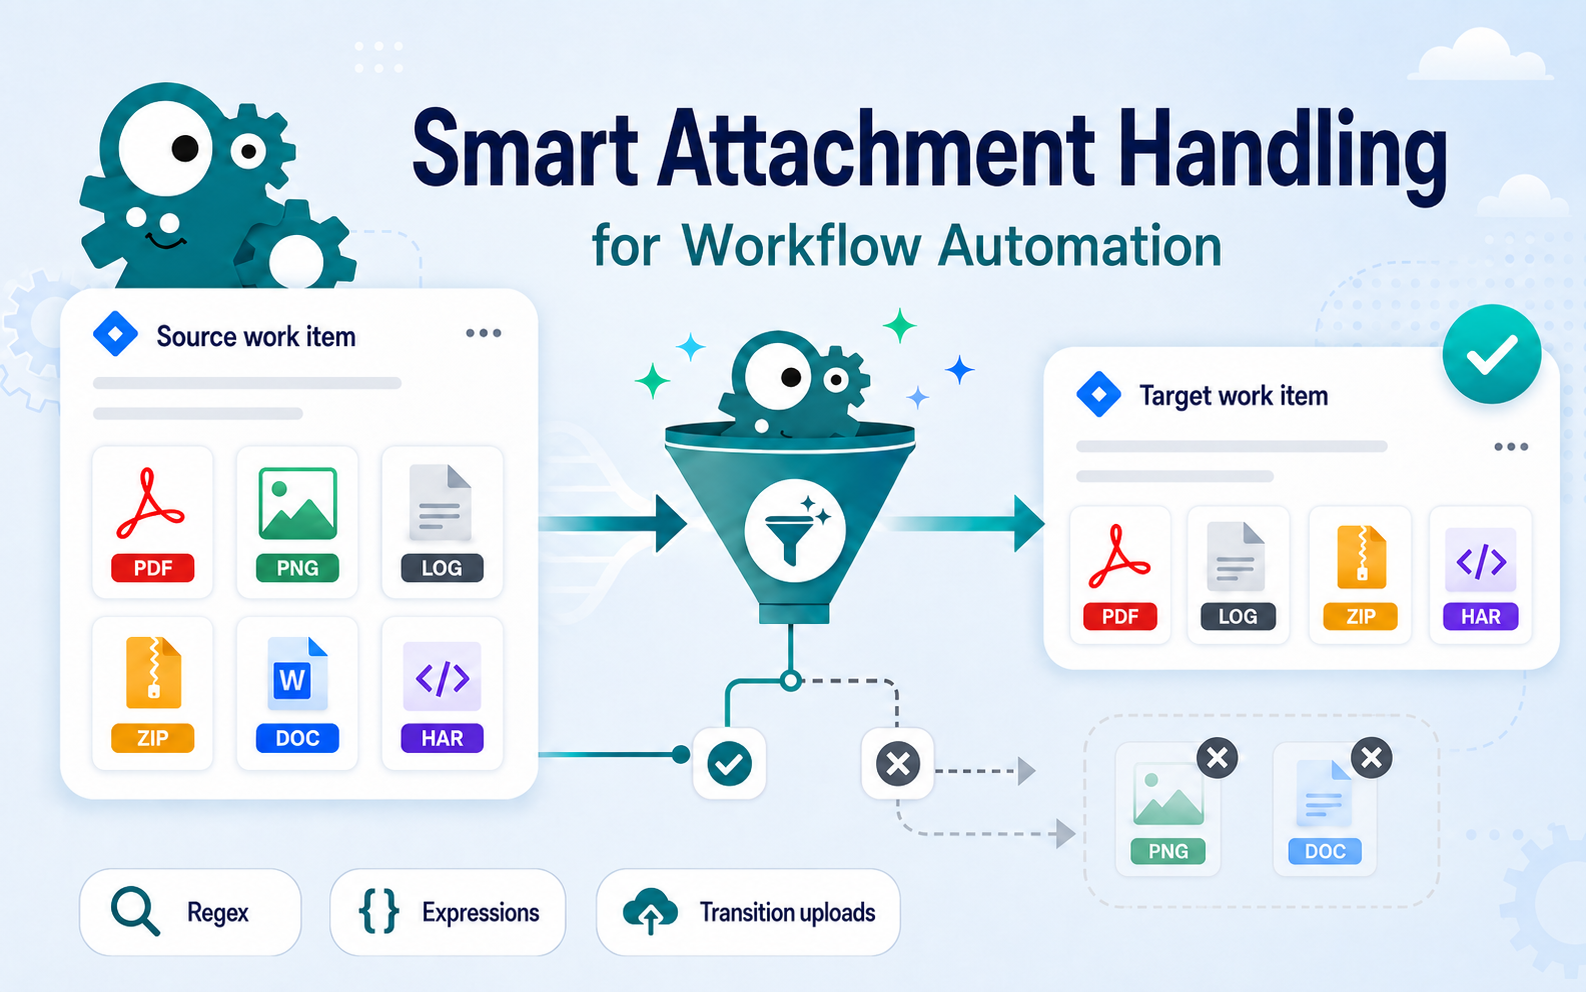
Smart Attachment Handling for Real Workflow Automation
19
Jun
2026
“Our team completed 75 story points -15 more than we committed to. Is that a success? Or a sign of shifting priorities?”
Sprint metrics can tell stories - but only if you can read between the lines.
For many agile teams, sprint retrospectives are plagued by ambiguity. Jira burndown charts show trends, but they don't explain the why. Key questions—like whether your team is overloaded, what kind of work is dragging velocity down, or how often scope is changing—go unanswered until it's too late.
That's where two Jira-native apps come together to bring clarity: 🔍 sumUp for Jira by Decadis, and 📊 Time in Status by SaaSJet.
Together, they form a Sprint Intelligence System:
Let’s explore how they work together - starting with the real-time insights you get from sumUp.
sumUp for Jira turns your dashboard into a real-time command center for agile delivery. Instead of waiting until the retrospective to understand sprint health, you can monitor key metrics as they evolve—scope creep, assignee workload, story point progress, and more.
sumUp is built around a flexible set of gadgets. You configure the filters; we do the math. No scripts, no exports—just insights.
“How much work was completed in this sprint? What got added?”
.png)
✅ Insight: Spot scope creep as it happens—not just in retros.
“Where is the workload concentrated?”
✅ Insight: Uneven workload across assignees? sumUp makes it visible immediately.
“Who's working on what kind of tasks?”
✅ Insight: If QA engineers are swamped with Stories instead of Bugs, maybe your grooming process needs a revisit.
“Where did the time actually go?”
.png)
✅ Insight: Spending too much time on medium-priority issues? Shift focus faster.
Monitor trends over time—velocity, workload, scope change—and compare across boards or teams.
✅ Insight: Whether you’re prepping a stakeholder update or a retro, sumUp helps you bring the evidence.
Time in Status by SaaSJet delivers a comprehensive sprint report that dissects performance across seven key metrics. Think of it as a sprint MRI—diagnosing issues like incomplete work, scope volatility, and priority misalignment.
%20(1).png)
Together, they close the agile feedback loop: Plan → Track → Diagnose → Improve
Agile isn’t just about delivering faster—it’s about learning faster. That means your sprint data needs to be more than an afterthought.
The combination of live metrics and retrospective insights will help your team continuously improve—and actually enjoy your retrospectives.
👉 Explore sumUp for Jira on the Atlassian Marketplace.
👉 Check out Time in Status and their Sprint Report.
📊 Set up your own Sprint Command Center today!
Mühelose Summenberechnung von Jira-System- und benutzerdefinierten Feldern - Story Points, Zeitschätzungen oder jede andere Zahl - ohne zusätzliche Konfiguration oder Code und Skripten.
Wir sind immer auf der Suche nach talentierten Menschen, die Lust auf digitale Herausforderungen haben.
Deine Stelle ist nicht dabei? Meld dich trotzdem, wenn du denkst, dass du den Unterschied machen kannst!


.jpg)
.png)


.png)


.png)


.jpeg)
![Last Log for Jira – Troubleshooting easier than ever [incl. Video]](https://cdn.prod.website-files.com/6400aa62efc52f275fa918d4/65aa7d8167dd440c0529c08e_Last%20Log%20for%20Jira_The%20key%20to%20troubleshooting%20in%20Jira.gif)


.jpg)


.png)


